Appearance
Dashboard Overview
The Dashboard is your home screen — the first page you see after logging in. It provides an executive summary of your organization's quality health.
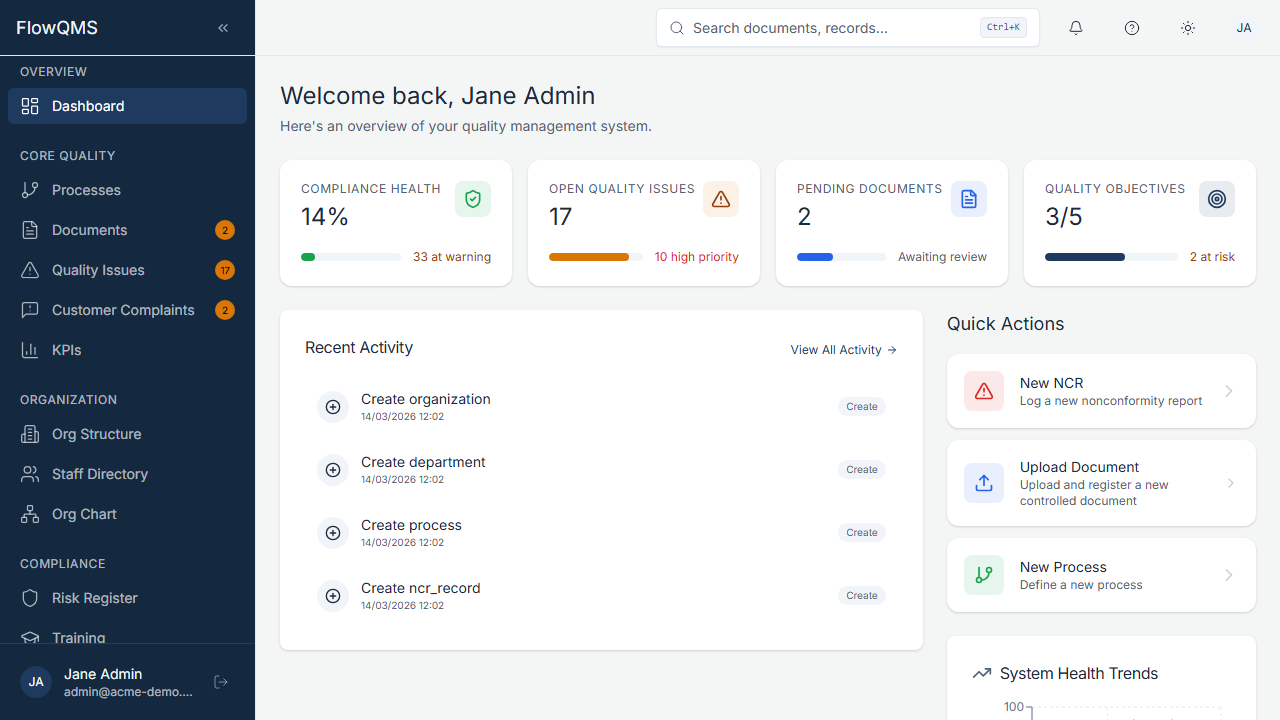
The main dashboard showing executive summary cards, quick actions, and quality widgets
Executive Summary Cards
Four key metric cards are displayed at the top:
| Card | What It Shows |
|---|---|
| Compliance Health | Percentage of KPIs meeting their targets. Shows a progress bar and the number of KPIs at warning level. |
| Open Quality Issues | Total number of open (unresolved) NCRs. Highlights the count of high-priority or critical issues. |
| Pending Documents | Number of documents awaiting review or approval. |
| Quality Objectives | How many quality objectives are on track vs. total (e.g., "3 of 5 on track"). Shows at-risk count. |
Quick Actions Bar
Below the summary cards, three quick-action buttons let you jump straight into common tasks:
- New NCR — Create a new quality issue / nonconformity record
- Upload Document — Create and upload a new controlled document
- New Process — Define a new business process
Dashboard Widgets
The rest of the dashboard contains interactive widgets:
| Widget | Description |
|---|---|
| KPI Status | Visual overview of your KPIs with traffic-light indicators (green = on target, yellow = at risk, red = off target) |
| Recent Activity | Timeline of the latest actions across all modules (e.g., "NCR-001 moved to Investigation", "DOC-005 approved") |
| Pending Approvals | List of items awaiting your approval (documents, change requests, etc.) — clickable to navigate directly to each item |
| Compliance Trend | Line chart showing your compliance score over time |
| NCR Trend | Chart showing the number of NCRs opened vs. closed over recent months |
| NCR by Source | Breakdown of NCR sources (audit, customer, supplier, process, etc.) |
| Quality Insights | AI-powered insights and recommendations based on your quality data |
Previous: Mobile Experience