KPIs (Key Performance Indicators)
The KPI module lets you define, measure, and track your organization's key performance indicators with visual dashboards and trend analysis.
Sidebar location: Core Quality > KPIs
The KPI module is organized into four tabs:
Definitions Tab
This tab lists all your KPI definitions. Each KPI definition establishes what you are measuring, the target, and the thresholds.
Creating a KPI Definition:
- Click "New KPI"
- Fill in the form:
| Field | Description | Required |
|---|---|---|
| Name | KPI name (e.g., "Customer Complaint Rate") | Yes |
| Code | Short code (e.g., "KPI-CR-01") | Yes |
| Description | What this KPI measures and why | No |
| Owner Role | Job role responsible for this KPI | No |
| Process | Link to the related process | No |
| Unit | Unit of measurement (%, count, days — configurable) | No |
| Frequency | How often it is measured: Daily, Weekly, Monthly, Quarterly, or Annual | No |
| Category | Process Quality, Financial, Customer Satisfaction, Employee Engagement, Operational Efficiency, Compliance, or Innovation | No |
| Target Value | The goal value (e.g., "< 2%" or "> 95") | No |
| Warning Threshold | Value at which the KPI is "at risk" | No |
| Failure Threshold | Value at which the KPI is "off target" | No |
| Higher Is Better | Toggle on if higher values mean better performance (e.g., satisfaction score). Toggle off if lower is better (e.g., defect rate). | No |
| Auto NCR on Failure | Automatically create an NCR when this KPI fails its threshold | No |
Measurements Tab
Record actual measured values for your KPIs over time.
- Select a KPI from the list
- Enter the measured value, measurement date, and optional notes
- View the history of all measurements for that KPI
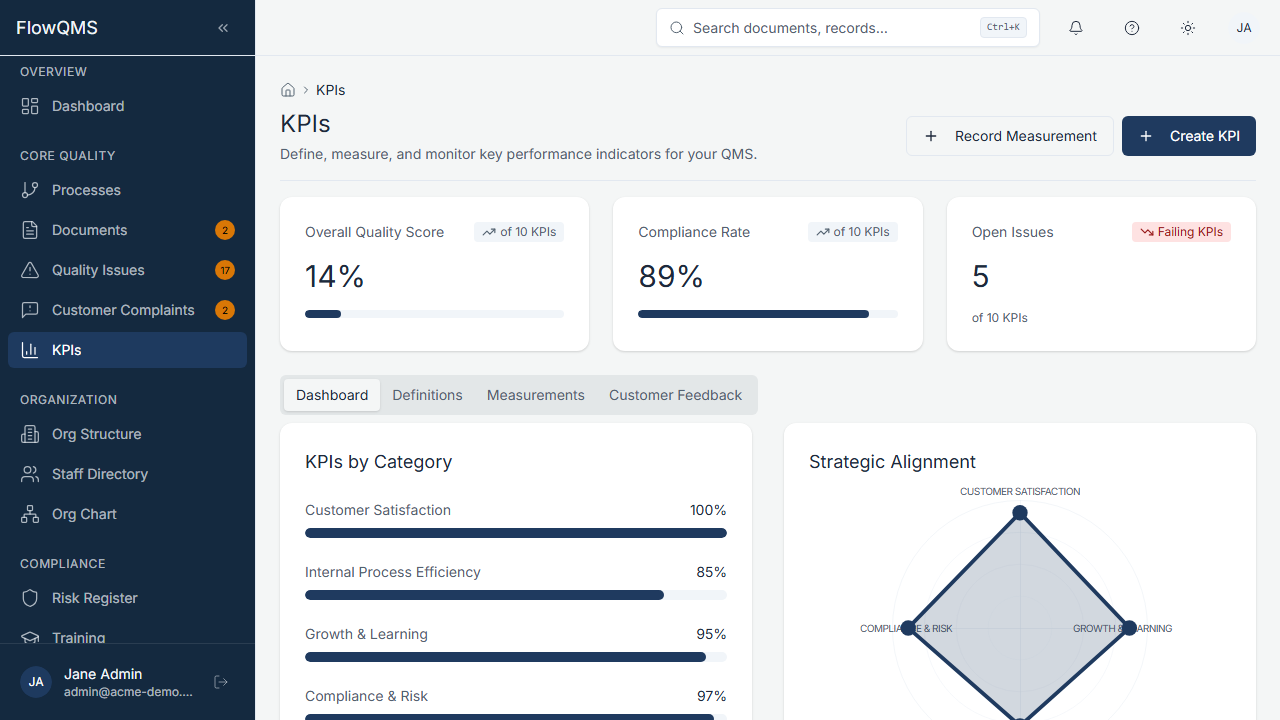
Dashboard Tab
A visual dashboard showing your KPIs at a glance:
KPI Cards — Each KPI is displayed as a card showing:
- Name and current value vs. target
- Trend arrow (up/down/stable)
- Traffic-light status: Green (on target), Yellow (at risk / warning), Red (off target / failure)
- Progress bar
Trend Charts — Line charts showing KPI values over time, with target lines and threshold bands
Customer Feedback Tab
Track customer feedback data that feeds into your KPI measurements. This tab provides a dedicated space for customer satisfaction metrics.